20 Ideas to Successfully Use Bully Data
6/28/2017


Back to the main Bully Prevention Guide.
Data, data, data….it can be cumbersome and it can consume you. How can you make the data you collect work for you? Many times people collect data and never use it. This is a waste of your time and possibly others as well! Get rid of unneeded data collection.
Unfortunately, many administrators have to collect data for reports to district, state, or federal officials. For example, the Office of Civil Rights collects data from all schools, but we seldom look at this data to make educational decisions at the school level….maybe we should!
I believe we should be collecting bullying data. One of the first steps a school must complete is a basic understanding of what "bullying" truly is and what it is not. Dan Olweus, from the popular Olweus Bully Prevention Program, defines bullying as the following,
"A person is bullied when he or she is exposed, repeatedly and over time, to negative actions on the part of one or more other persons, and he or she has difficulty defending himself or herself."
A school staff must agree on and continue to talk about what truly are the bullying incidents in their school. Bullying often times gets confused with rough tumble play and arguments. We must make it more concrete for everyone.
Here are 20 ideas to implement the use and collection of bully data. You may be using some of these ideas already, and if you have more, please email or post them in the comments below.
PU#84 - Track Data: Bully Incidents Per Day, Week, Month, Year
Tracking bully data should start with documenting how often the behaviors are occurring. Collecting data that tells you the amount per day, per week, per month, and per year will give you an enormous amount of information that you can use immediately. To determine if you have a bullying behavior problem, compare your data to the national average or to other schools of your same demographics. This data can be hard to find, and few school districts across the country report the data in this manner. SWIS, or School-wide Information Systems, is a data warehouse for behavior referrals and can tell you how it compares overall referrals to national averages. I am hard-pressed to find bullying data reported in this fashion.
The state of Florida in 2013-2014 published a report titled, By the Numbers: Bullying in Palm Beach County and Treasure Coast Districts and Schools. Florida's bullying incident data was collected, compared, and ranked. For example, that data stated that ten schools in the Palm Beach County School District were responsible for one-third of all reported bully incidents by the district (Palm Beach County School District has 187 schools serving 188,000 students). Some schools reported zero, while the top schools reported upwards of 14 bully incidents.
If your state, school district, or individual school does not tally the number of bully incidents in this manner, start now. This will give you data that you can analyze and set goals for the future. In my school, we work hard on determining the rationale and cause of the incident to determine whether it truly is a bully incident or not. In the 2016-2017 school year, our school reported five incidents of bullying behavior in which an office referral (how we track it) occurred on campus. In 2014-2015, our school reported 15 incidents of bullying behavior. This is a drastic change in two years. Some of the reasons for this change can be attributed to specific students who moved to the middle school. These students were responsible for two-thirds of the 15 incidents. Another positive avowal was the continuous professional development and focus by staff on reducing bullying incidents.
We look for patterns over time and develop behavior plans for all students who we have an identified a pattern. In order to reduce the referrals and incidents we track three characteristics of the behaviors: frequency, duration, and intensity. We put interventions in place in order to reduce all three characteristics.
If your school has a vast amount of bullying behavior reported it would be useful to dig deeper with the following ideas.
PU#85 - Track Data: Bully Incidents by Location
Collecting data by the location can lead to several solution-based discussions by staff and students. Look for patterns in the data. You should be able to rank the locations on your campus where most of the bully behavior occurs.
Obviously raising awareness is the first step to stopping the bullying behavior in these locations. Second, staffing these locations with personnel is one of the first ideas to reduce incidents. Letting students know about this data is important to keep the students safe, letting them know about these locations can powerful as well. Students can be the first line of defense in getting these incidents stopped.
Locker rooms, bathrooms, and obscure hallways can all be tricky to supervise. Many schools have developed staff duties around these areas, as well as increasing the number of video cameras in appropriate areas. Staff may be hindered by regular locker room or bathroom checks, but communicating to students proactively that we will be coming in to supervise for safety is a necessity.
I remember coaches in high school not entering the locker room while students were changing. For whatever reason, they did not supervise this portion of PE or athletic practice. There were many bullying incidents, and students did not want to tattle for fear of retribution, or fear of being called a "tattle-tale." We can take this feeling away from many students by telling them ahead of time, "For safety, I will be walking through the locker room routinely to make sure everyone is doing their job to get in and get out."
PU#86 - Track Data: Bully Incidents by Time of Day
The time of the day a bully incident occurs can be sporadic, and sometimes it can be predicted. When behaviors create a pattern of predictability, the staff can take action. Looking at the school schedule, location of staff during this time period, and other events going on while these incidents occur can give you some ideas on what the school can change.
For example, if there continues to be increased bullying incidents at 1:00 PM during the school day, you must investigate further to put an effective plan in place. Start by asking a few questions such as the following:
- What is going on school-wide at 1:00 PM?
- What locations are the incidents occurring at 1:00 PM?
- What staff can be moved their or rescheduled to support at 1:00 PM?
- What procedures can we put in place, practice more, or change in order to reduce the incidents at 1:00 PM?
- Is this situation a systemic problem, or can we identify one or a few people responsible for the behavior or lack of supervision?
PU#87 - Track Data: Bully Incidents by Grade Level
By digging into the data, can you separate bullying incidents by grade level? If so, rank your classes by the number of referrals. Which grade is leading in referrals?
Once you find the answers to these questions, you can then put some interventions in place. Are the bullying referrals spread among several students, or is there a few students that have most of the referrals? If it is just a few students, a behavior plan can be put in place to curtail and reduce the number of referrals. More professional development for the teachers of these students might be a logical solution, also. If the referrals are spread out among several students, you might assume there is a classroom culture problem. Students and teachers need more strategies in order to deal with the bullying incidents.
Taking this data school-wide can be powerful. For example, if the second grade leads the school in reported bullying incidents, a school-wide plan can be implemented. A positive behavior intervention system that recognizes students doing the correct thing would support these students. All staff members can team around this grade level and support in the hallways, on the playground, at arrival or dismissal, and more.
PU#88 - Track Data: Bully Incidents by Gender
Since I started tracking bullying incidents in our school in 2011-2012 school year, I have found that approximately 80% of our bullying referrals have been from males. Likewise, roughly 85% of all referrals have been from males in our school. This correlation is unsettling to say the least, but is important information for the staff to understand. Are we incriminating males more than females? Though our numbers might support that, we have a large amount of male students who have behavior problems requiring a behavior plan. This statistic also mirrors the male-to- female ratio we have in our Comprehensive School and Community Treatment Program (CSCT).
When you look at your data, what does it tell you? As a school, we will be focusing on learning more strategies to work with students, especially males, which have encountered trauma and anxiety. Classroom teachers will continue to build their tools to work with young males.
PU#89 - Track Data: Bully Incidents by Staff Member
As you dig into your data, you start to see a pattern. One grade level continues to surface with alarming data. One teacher is responsible for a majority of all bullying behavior incidents. As a colleague, you want to support the teacher, but you must dig deeper in order to understand. You find there is one or two students that have all the referrals. These students may have behavior plans and their incidents are well known by staff.
You also may find that a teacher is going after one or two students repeatedly. The staff member does not know how to interact or form a relationship with the student (*Number one strategy to stop bullying incidents is for students and staff to have a relationship). Digging deeper you may find that the teacher needs more tools and strategies to work the student. A plan for professional development can then be devised. Using the data will support your goals in the implementation of the chosen professional development.
PU#90 - Track Data: Top 5 Offenders List
Johnny keeps popping up in your data. Do you have a plan for him? Does he have strategies that he can use when he feels anxiety or stress? If not, the bullying behavior may persist.
Look at the top five bullying offenders in your school. Do they all have behavior plans? If not, start with team meetings to devise a behavior intervention plan that targets the exhibited bully behaviors.
You may keep this information private, but if these top five offenders are affecting your whole school, the rest of the staff can be part of the solution. Again, a PBIS can support these students by having staff recognize and praise what they are doing correct. Increasing positive interactions with these five students by all staff members shows them we care and lets them know "Bullying is NOT what our school is about!" Remember, having at least one staff member that can say they have a good relationship with that student can keep them in school and on track for success.
PU#91 - Track Data: Bully Incidents by Sub Group
As the Office of Civil Rights looks at our bullying data (even collecting data by sub groups), we must do this as well. Eliminating bias can be extremely difficult. The culture and community's perspective on the school district can play a large role in how parents and the community support your school. Creating trust is the first step with all families.
Recently, we have been hearing statistics about the suspension rate of African-Ameican's as compared to other sub groups. In a recent OCR report titled, Persistent Disparities Found Through Comprehensive Civil Rights Survey Underscore Need for Continued Focus on Equity (June 7, 2016), it states, "Black preschool children are 3.6 times as likely to be suspended as are white preschool students." We must be self-reflective as a school and as an individual teacher to understand how our bias decisions effect the students in our school. What does your discipline data tell you and does it align with your school or district's demographics?
PU#92 - Track Data: Data Driving Monthly Themes for Socio/Emotional Program
School districts across the United States are being required to implement socio-emotional programs in their schools. What was once thought of as fluff or extraneous is now emphasized as best practice. In my school district in the past, the school counselor taught the socio-emotional curriculum 30 minutes per week. As classroom teachers implement these programs school-wide, we find the need for all staff members to be aware and teach the philosophy and strategies to our students. Data should drive our instruction. We find out what the students do and do not know, and we then can tailor the curriculum, instruction, and assessment to meet their needs.
Similarly, we must use our referral data, and more specifically our bullying incidents, to support our decisions on teaching our students. We may find areas that we can implement curriculum and ideas school-wide, grade level specific, or even small groups in classrooms. Monthly themes may be powerful for the entire school to focus on socio-emotional topics: January = Kindness, February = Friendships, March = Heroes, etc… Devised activities that connect to each monthly theme can be grade level specific or whole school based.
PU#93 - Track Data: Data Driving Classroom Instruction
Behavior data can drive classroom instruction. Tracking behaviors that lead to bullying are important to note. The greatest precursor is the use of unkind comments. Tracking them throughout the day can give you a baseline for this unwanted behavior. Remember, unkind comments, if repeated over time with an imbalance of power as listed in the beginning of this article, are bullying behaviors.
Setting up a plan to decrease these unkind comments is a great place to start. For example, if you have 10 unkind comments between the times of 10:30-11:30 AM, you can set up a plan to address it with your instruction. The teacher can limit group work, add in reflection or yoga time, or even add in more writing that is individual. Additionally, a teacher can add in a class meeting during this time where these issues can be addressed, practiced, and praised.
We must not be afraid to veer from our designated plan of instruction. Being proactive and taking the time to tackle these issues will actually give you more time in the end, and hopefully the frequency will decrease. If it does not, keep trying something new!
PU#94 - Track Data: Data Driving Counselor Programs
Counselors can be play a huge role in changing student behaviors. Using data from bullying referrals gives the counselor background into what topics and behaviors he or she can use when instructing. Whether the counselor uses whole class lessons, small group sessions, or individual one-on-one sessions, the data can drive the instruction.
Recently in our school, we have been dealing with an increase in social media posts that are inflammatory to other students. Though many of these incidents of bullying occur outside of the school walls, many times their impact during the school day is visible. When these out of school events affect the school day, staff members can do something about it. Our classroom teachers, librarian, and counselor increased the weekly meetings with students and discussed social media.
Data should drive these discussions, as well as age appropriate material that they may be encountering in the future. Building skills and strategies of students will support them being proactive when they encounter these situations.
PU#95 - Track Data: Data Driving Professional Development
All staff members should receive a minimal level of professional development to deal with bully behaviors. In our school district, all staff members are required to learn about the district-wide Olweus Bully Prevention Program. This base level of information given should only be the start to professional development that targets bullying. Continuous bullying education is essential.
Data from bullying referrals can drive what professional development you receive. Whether it is a full day workshop, a Professional Learning Community (PLC) training, or even a staff meeting discussion, professional development can be tailored to the specific behaviors that are exhibited in your school and classroom.
For example, if your data tells you that many of your bullying incidents come from students identified with Oppositional Defiant Disorder (ODD), the staff can build their skills and strategies to work with these students. As previously stated, in my school the male population receives a high percentage of bullying referrals. We will continue our work with strategies for young male students.
PU#96 - Track Data: Data Driving Purchased Resources
Many times schools buy materials and use the "Spray and Pray" approach with its use. That means we purchase materials in hopes that it helps our students without actually connecting it to the needs of our students. With limited time and resources we must be more targeted with our money.
By looking for patterns in our bullying behavior data, we can target specific behaviors, set goals, and find resources that best fit the implementation plan to meet those goals. For example, a school that is working on "girl drama" could form a team and attend this outstanding conference in hopes implementing newly gained information: National Girl Bullying Conference.
PU#97 - Track Data: Data Driving Outside Services Connected to School
Many schools have outside mental health services connected to their school, especially with Medicaid eligible students. When we dig deeper into many of these stories of bullying, we find that health is a consistent issue. Whether it is mental or physical health, the easier it is to connect and access these services to our students, the quicker they can be successful.
Recently, our school added another CSCT program as we noticed the mental health increasing in our school. Our bullying data was not connected to this additional need for this team, but in a school that has a large amount of bullying behaviors, this may be an idea for added support.
To learn more about a school district that has taken this approach on by putting several community-based services on their campus, read about the Walla School District or watch the movie called, Paper Tigers.
PU#98 - Track Data: Data Driving Parent and Community Forums
Depending on the severity of the bullying incidents in your school, a parent and community forum may be the next step to raise awareness. We always have a hesitation on releasing data to our community. Who owns this data…the school, or parents and community? The answer should be both. This data is our students and our community. We can only decrease this data with the support from parents and community members.
Having a set goal for your forum is the first and foremost priority. Who will be asked to attend? Who will present the information? How will you make the forum solution-orientated? Sharing data, creating goals together, and putting the plan into action will all be important in the effectiveness of decreasing bullying incidents.
PU#99 - Track Data: Collect Data to Celebrate Progress or Focus the School
Much of this data can be viewed in a negative manner. We must move away from only communicating the negative, and find the positives somewhere. By celebrating the positives with staff, students, and the community know that we are making the decrease of bully behaviors a priority in our schools.
Once we reach a goal, we must re-focus our school on the next thing. Staying stagnant leads to mediocrity and the unwanted bullying behaviors may pop back up again.
PU#100 - Track Data: Collect Data from Year to Year to Compare Students, Grade Levels, and More
As you collect data from year to year, you will inevitably notice patterns. You ultimate goal is being able to celebrate a decrease in bullying incidents with students, staff, grade level teams, parents, and the community.
When you devise a plan for a student who exhibits bullying behaviors, data should drive your interventions. Two to four weeks is typically a good interval to determine if an intervention is effective. Many times educators change interventions too soon and without giving it a chance to ensure fidelity of its implementation. Discussing changes of the interventions by a team is essential by looking at the following data: frequency, duration, or intensity. If there is a negative trend in the data or there is no visible progress in the data, it is a good time to change the intervention.
A developed plan for a teacher or grade level can be used to combat bullying behaviors. Professional development (PD), resources, and other training can support these teachers. If one specific teacher's data shows trends that are not typical of other teachers, and after investigating further you find a lack of personal skills and strategies, an individual plan of improvement can be implemented. For example, if a teacher routinely argues with students that are diagnosed with oppositional defiance and refers the students to administration for bullying incidents, administration may need to investigate further and build a personal PD plan.
School-wide data supports the specific interventions that the whole staff can initiate. A school can create a leadership team that helps determine what interventions will be successful. For example, if a school implements a new socio-emotional program and teachers are expected to cover certain lessons with students, the lessons can be tracked.
PU#101 - Track Data: Bully Incident by Type of Incident
There are an infinite number of ways students can bully other students. Tracking the specific behaviors and rationale of all bully incidents will give insight into goals that can be set by school staff. Only labeling an office referral as "bullying" is insufficient in order to set effective intervention plans.
When a school digs deeper, they can learn more about the rationale for a student's behavior. For example, by looking at referrals you find that there is a common pattern with a group of fifth grade boys. They are taunting other students during football at recess. The taunting has been towards one or two students repeatedly. By digging deeper you find that the students need more work on sportsmanship, the rules of football at recess, and problem solving. I plan can be put in place by the classroom teacher, recess teachers, and administration to support these fifth grade boys.
PU#102 - Track Data: Bully Incident by Intensity and Severity
Reported bullying incidents can be as small as a girl staring at another girl. This is repeatedly down over time and there is an imbalance of power between the two girls. How staff deals with this incident does have an effect on the school environment. The severity and intensity of this situation may sound like a low-level incident and the teacher or administrator may not take any action. In fact, many times we tell students to "just ignore it." We have to be cautious and take these situations serious in the same manner that we do with the more observable bully behaviors. This student most likely believes the staff member is not going to support them in getting the exhibited bully behaviors stopped. The incidents may raise to the next level, but the student will not come to the staff member.
Tackling this issue at the lowest level is a great strategy to be proactive and preventative. Staff members should be addressing this issue by documenting information so the behavior can be tracked over time. Documentation and addressing it with students may take a total of 3 minutes. Those three minutes may save you and your staff hours if this behavior continues or escalates. As the behaviors increase in intensity and severity between these students, or to the provocative victim by someone else, effectiveness of the solution starts with detailed documentation. Appropriate consequences and re-teaching opportunities may be increased or advanced as staff have dealt with the prior situations and they are documented.
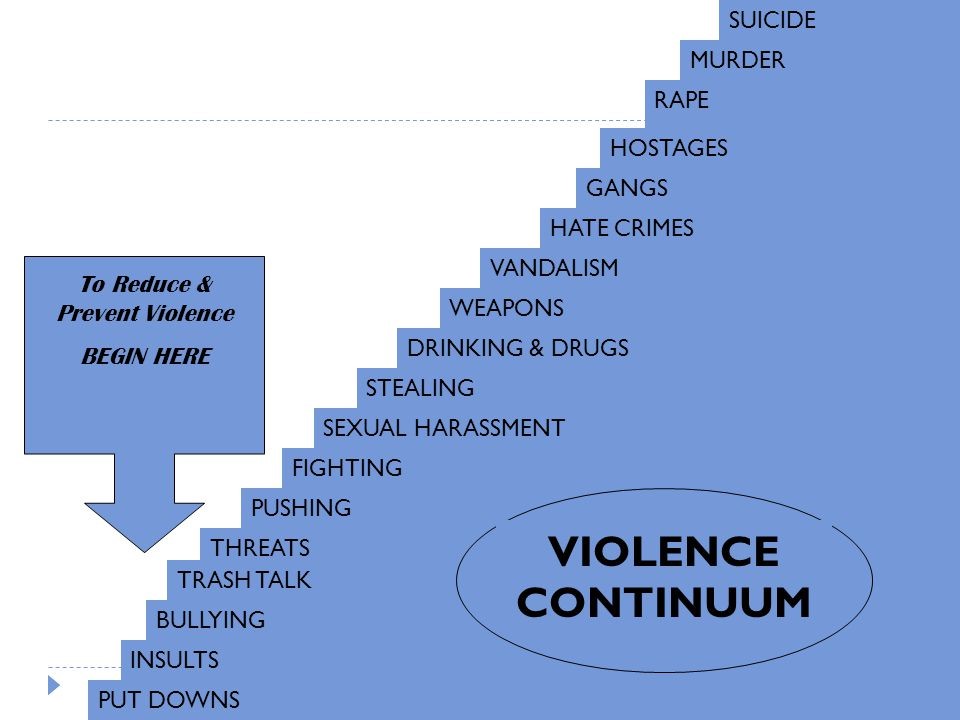
When we bullying behaviors occur, we need to make sure to document the intensity and severity of the incident with both qualitative and quantitative data. Appropriate and effective interventions can then be implemented as these incidents increase in severity. As you can see from the violence continuum below, being proactive starts with educating all staff members on the importance of stopping bullying behaviors at the lowest level.
PU#103 - Track Data: Data Driving School-Wide Procedures and Universals
Bullying data can be analyzed in numerous ways. This valuable data can change the culture of a school, as well as effectively changing the procedures your school establishes. If your bully data tells you that a high percentage of incidents occur in the hallway, establishing procedures for both students and staff is one possible solution. In our school, we teach students the FLLOW procedure. We practice this routinely throughout the school year (AND…to be honest, we could do a better job at the end of the year, but I am proud of the work we do on these in the beginning, practicing throughout the year…the end of the year could be much worse!). Look at this I-Chart for our school's hallways:
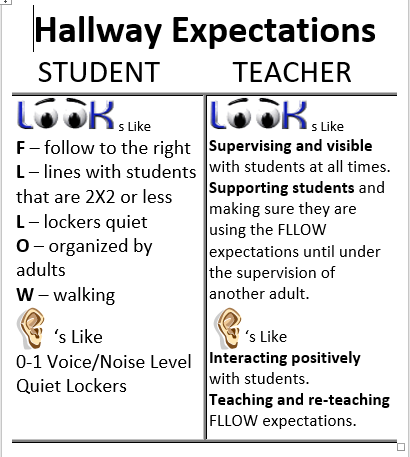
We call this an I-Chart because "I" stands for "Independence." We want our students to learn our procedures so they can do them independently without our support. Until they can do it independently, we must continue to support them!
Many "Looks Like" and "Sounds Like" Charts only take into account what we want the students to be doing. In this I-Chart we include what staff will be doing. We teach students to look for staff members: 1) supervising and being visible in the hallways, 2) supporting students with FLLOW expectations in the hallway. We also teach them that staff will "sound like" the following: 1) interacting with students positively, and 2) teaching and re-teaching FLLOW expectations. This next step gives all staff an expectation, as well as students holding the staff accountable to these stated expectations, too!
MORE BULLYING PREVENTION GUIDE RELATED READINGS:
- 3 Types of Bullying in School + 1 Immense Social Challenge
- 5 Reasons Why Schools Have a Difficult Time Stopping Bully Behaviors
- 5 Reasons Why We Need to Define Bully Behavior and Stop Generalizing Events as "Bullying"
- 6+ Steps to Addressing Bullying When It Occurs
- 9 Strategies We Can Teach Students to Problem Solve
- 7 Ways How to Raise a Defender of Bully Prevention
- Provocative Victims and 7+ Practices for Victory
- One School Wide Philosophy: High-Trusting Relationships
- 13 Ideas to Combat Bullying at the Community Level
- 6 of the Most Hideous Cyber Bullying Tactics Used By Students
- 11 Communication Strategies to Combat Bullying
- 20 Ideas To Successfully Use Bully Data (Currently here)
- 5 Reasons Why Strong Instruction Affects Bully Prevention
- #1 Instructional Lesson for All Students on Bully Prevention
- Power of Buddy Classrooms: 19 Ideas
- 8 Ways to Teach Empathy
- 10 Ways to Empower Defenders
- 9 Reasons Culture Trumps Strategy
- One School Wide Strategy: Kindness Campaign
As a 5th grade teacher, in 2010 Jon won the Presidential Award for Elementary Math and Science Teaching (PAEMST). As a principal, his school won the 2012 Blue Ribbon Award. In 2018, he won the National Distinguished Principal Award (NDP). In 2019 he won the National No Kid Hungry Breakfast Hero Award.
Jon is the author of three guides published on teacher.org: An Educator's Guide to Combat Bullying & Bully Prevention; Teacher Evaluation: A Transition Guide to Exemplary Performance; and You are the Wild Card: Infusing Fun Back into Curriculum. He has authored a children's picture book that was released January 2019 titled Benjamin’s Visit to Principal Reads Office…again! (available at www.archwaypublishing.com)
- Learning How to Say No and Set Boundaries with Parents - November 21, 2022
- If You Had Only One Behavior Strategy to Use in Your Classroom, What Would It Be? - September 26, 2022
- Live Your Code: 7 Strategies That Will Help You Be the Most Effective Educator You Can Be - August 15, 2022