3 Things You Should Be Tracking with All Behavior
9/17/2016


One of my pet peeves is to walk into a room, say a teacher's lounge, and hear teacher's griping about a student's behavior. I understand we must talk to colleagues about school life, but continually knocking down students isn't going to make the problem better. In our school we call it "sniffing a turd." That may sound funny or absurd, but it actually is just that…and why would we do it. Too many people get stuck in a rut of only talking about the problem. They never offer any solutions to the problem. They are ultimately stuck sniffing! They observe it, talk about it, they may even get a large group of colleagues to do the same…but, none of this solves the problem! What we need to be talking about are these three facets of all behavior: 1) Intensity, 2) Duration, and 3) Frequency. The ability to track this information can change these conversations to something more productive and solution-orientated. The goal is to obviously decrease the data in these three areas, look for patterns, and then decide to continue, change, or stop specific interventions.
I first learned about these three data points from my principal-colleague and friend, Ryan Hart. He said, "What are you doing? You need to be looking at the intensity of the behavior, how long that behavior lasts, and how often it occurs." I looked at him dumb-founded and said, "Yes, why haven't I been doing that?" If you think about it, all behavior (I can't think of one that can't be tracked) can be tracked with these three data points. The next thought after this initial discussion: what kind of data tracking tools can I create?
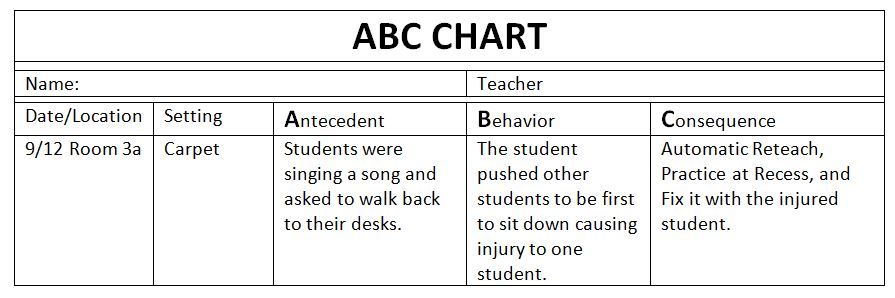
INTENSITY
A behavior's intensity can be difficult for an educator to determine and track. We have to dig deeper by using tools that describe the behavior. One such tool is an ABC Chart (Antecedent, Behavior, and Consequence Chart) like the diagram below. Anecdotal data is powerful when you place all of the charts together over time. I remember one such student in which we tracked "intensity" through his physical outbursts towards students and staff. On the ABC Chart you could see on Monday's and Friday's his behavior increased: tipping over desks, fighting with other students, arguing with all adults. When we continued to interview him we found he had a lot of anxiety to go home on Friday's, and then he brought a lot of the anxiety to school with him from being at home on Monday's. This needed data was used to devise a plan for school and home.
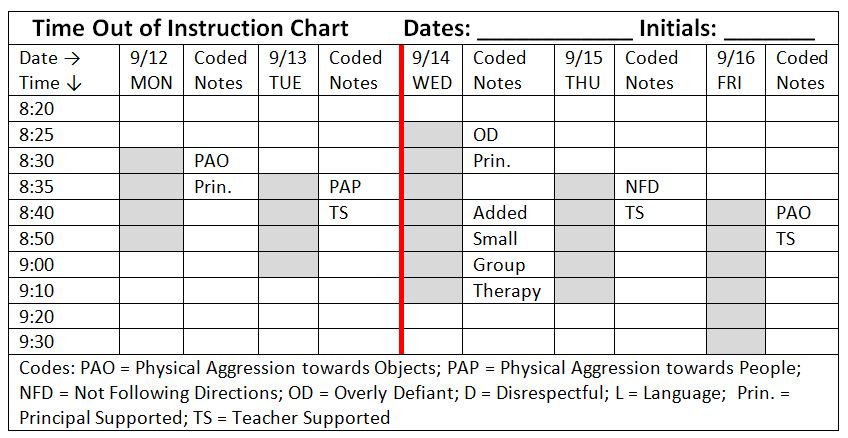
Tracking the duration of a behavior is vital to making any successful improvement. A student who can throw a tantrum on the ground that includes kicking, screaming, and flailing for 90 minutes is going to need more intense support than a student that does the same for only 3 minutes. Another example is a student who always becomes argumentative in the afternoon after lunch. You can collect data on the time of the day and graph it. You now have a tool that you can speak to with colleagues and make decisions. Deciding what interventions and supports you put in place can be marked on this graph. Any changes can be added with a phase line. Here is one example of a chart where you can track off task or out of class time.
DURATION
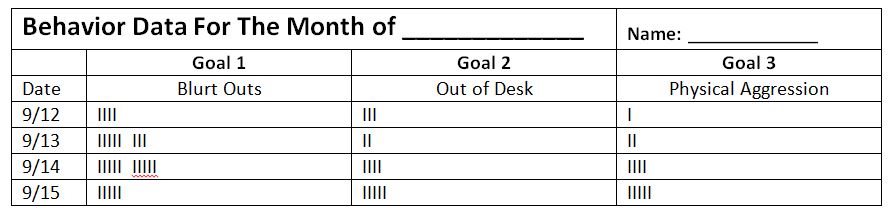
FREQUENCY
The ability to track the frequency or number of times a behavior occurs gives you a good idea on the magnitude of the problem. A student who gets up out of their desk seven times a minute may need a visual tracker. They can start to own and see on the chart how big a problem this may be with missed instruction, as well as it being a huge distraction to others. Developing interventions and ideas for a student becomes tangible when you put a number on it. In fact, it may be necessary to only track a small time period during the day because the behavior is so frequent. The teacher may have to track the data at first, but handing over the ownership of this task to the student can be powerful. Here is an example of one type of tracking tool for frequency, Frequency Tally Chart.
By combining all this data, you can get a pretty good picture of any behavior. You can then decide on what intervention or support best meets the need of the student. The obvious goal is to decrease the data. Deciding what your school will do with this data is important. Too many times we are collecting data on behaviors that are random, does not show a pattern, or is not useful when we start, change, or decide to continue an intervention. Communication with this data across your school gives you a common language, as well as letting others know the degree of the problem. What types of charts or data collection tools do you use?
RELATED - Is Teaching Right for Me? & How to Become a Teacher
As a 5th grade teacher, in 2010 Jon won the Presidential Award for Elementary Math and Science Teaching (PAEMST). As a principal, his school won the 2012 Blue Ribbon Award. In 2018, he won the National Distinguished Principal Award (NDP). In 2019 he won the National No Kid Hungry Breakfast Hero Award.
Jon is the author of three guides published on teacher.org: An Educator's Guide to Combat Bullying & Bully Prevention; Teacher Evaluation: A Transition Guide to Exemplary Performance; and You are the Wild Card: Infusing Fun Back into Curriculum. He has authored a children's picture book that was released January 2019 titled Benjamin’s Visit to Principal Reads Office…again! (available at www.archwaypublishing.com)
- Learning How to Say No and Set Boundaries with Parents - November 21, 2022
- If You Had Only One Behavior Strategy to Use in Your Classroom, What Would It Be? - September 26, 2022
- Live Your Code: 7 Strategies That Will Help You Be the Most Effective Educator You Can Be - August 15, 2022